
A before- and after-installation analysis of Jenoptik’s Specs average speed cameras has shown that the technology really does save lives – cutting fatal and serious collisions (FSC) in half.
The analysis was carried out by Agilysis, a company that crunches data to monitor road safety programmes.
It analysed 194 UK sites where Jenoptik’s cameras have been installed as a permanent measure. Of these, 120 had post-installation data. Comparing accident data before and after the installation shows that annualised figures fell from 259 before Specs speed schemes were introduced to 129 afterwards.
Finding that cameras can have such a significant positive effect on FSC “is actually a pretty powerful thing to say”, points out Jenoptik deputy managing director Geoff Collins.
Collins gave Agilysis the location information on every single column that hosts the cameras and the date that the equipment was “ready to go”.
“For example, if you’ve got a 10km route, there will be a number of columns - typically every 2km or something like that,” he adds.
This allowed Agilysis to plot the information on an interactive map and compare it with the Stats 19 Data – the official Department for Transport data that relates to road casualty reporting from the police.
Confidence calculation
Using the map and the casualty data, Agilysis looked at the baseline period, which is typically both three years before and after the installation to work out a “confidence calculation, and just have a look to see what has fundamentally changed”.
“If you consider there were probably thousands of columns and hundreds of cameras, and you need to have enough data going back far enough and after installation for it to be significant,” Collins ponders.
“There were 120 routes there, which had all of the ‘before and after’ data and there was no cherry picking at all, and that came out with a 50% reduction to the fatal and serious collisions.”
While the information on FSCs is instructive, the technology itself has also been put in place for reasons other than casualty reduction, such as protecting a bridge.
“There might be a bridge, where if you drive too quickly, you’ll damage it, and therefore there is a speed limit there. You also have them there for traffic management considerations as well, when you’re trying to merge things together.”
The study also found a 43% reduction in personal injury collisions – incidents where someone is less seriously injured.
“If you had a rear-end shunt, and somebody hurts themself, and actually does need to have some hospital treatment, that would be considered a personal injury collision,” Collins elaborates.
Local environment
However, Collins recognises there are other variables that go beyond the technology and need to be factored in.
“For example, if all of your casualties are from motorbikes during the day, you might take a different approach to a route where the problems are at 2am from single-occupant cars driving too quickly. It’s a different causation factor, and you might address it in a slightly different way.”
Geographic considerations for this kind of work include the number of lanes, the lines of sight and where the traffic junctions come into the road.
According to Collins, they have different characteristics: “So a 20mph road in the middle of an urban setting will be very different to a four-lane motorway, will be very different to a rural road winding through a forest leading up to a mountain.”
This new study builds upon a methodology used in a 2016 study carried out for the RAC Foundation on the ‘Effectiveness of Average Speed Cameras in Great Britain’.
There were only 55 valid sites at this time, but Collins points out there has since been a “real uptick” in the number of average speed installations – something which he thinks is largely because people appreciate that they do reduce collisions.
Elaborating further on the analysis, Agilysis CEO Richard Owen says the company looked at the location of the first and last camera and then produced a short buffer either side based on average speed of traffic.
“If you think about the zone of influence of the camera, it doesn’t actually extend very far either side,” he adds. “But we do know, from looking at average speed profile data, that within the average speed cameras themselves compliance tends to be really good.”
Owen says people tend to slow down once they get into the zone, although there may be some later braking as they enter them, “but by and large we know that they control speed”.
Collision data
Looking ahead, Owen confirms that the company will keep the interactive map up to date whenever it receives a new year of collision data.
Additionally, Agilysis has created an online dashboard that enables Jenoptik to have a look at each of their individual sites.
“And one of the things that we’re thinking about is how can local authorities and police forces get access to this map,” he explains.
“Getting this data into the hands of people in the public sector that are responsible for making our roads safer, and perhaps even members of the public as well, might be useful.”
Owen believes there is also room for some “potentially future interesting work” in which the data could be broken down further.
“Has it been a reduction in vehicle-only collisions, or has it been a reduction in collisions involving vulnerable road users? Is it better at certain times of the day, days of the week, weather conditions?” he ponders.
“There’s so much more data that you can dig into this kind of analysis to try to figure out why the reductions are happening.”
The analysis shows that combining cameras with an understanding of the local environment does create a winning formula for reducing collisions. As usage of the technology continues to increase, it seems likely that the technology has a chance of continuing to drive down FSCs.
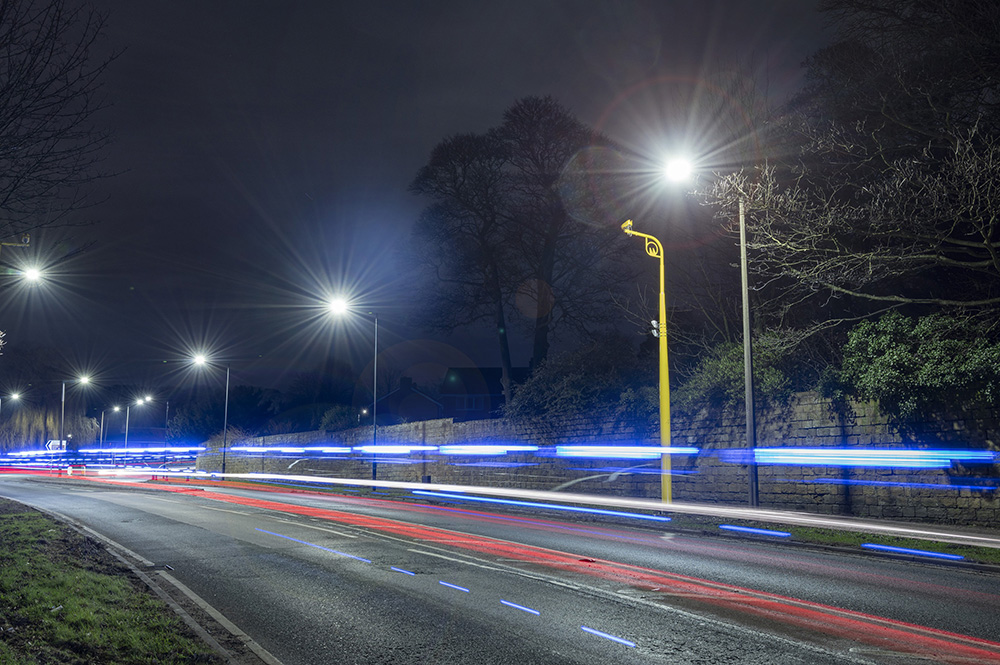
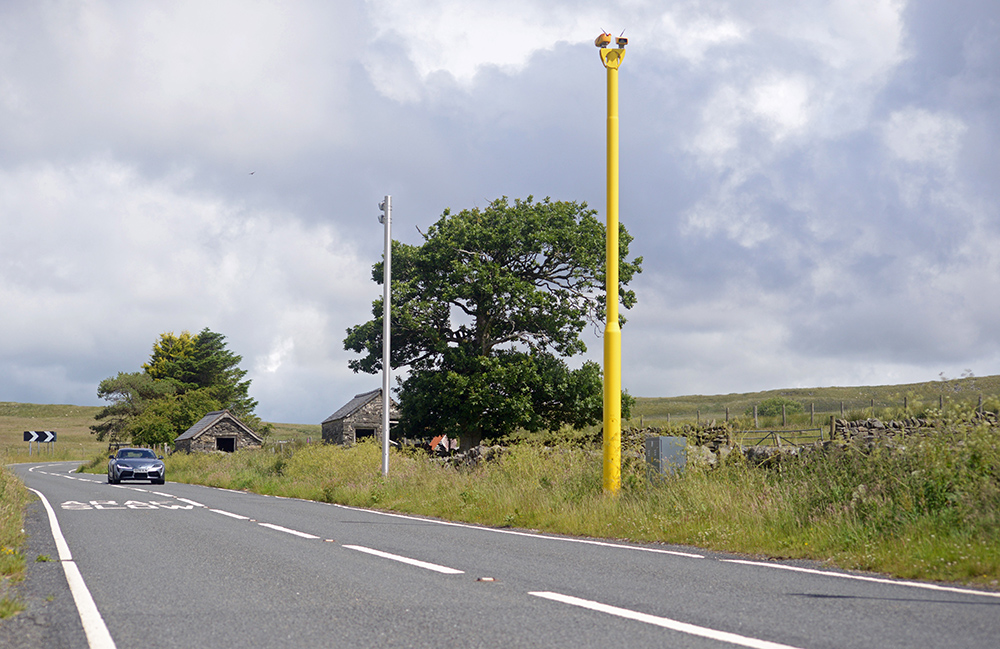
How does average speed enforcement work?
Jenoptik’s cameras temporarily log an image of the vehicle, providing a file that has images, the vehicle registration number and the time and location.
The firm’s deputy MD Geoff Collins explains: “The registration mark and the time are routinely squirted back to a remote server, which will maybe notice that a vehicle registration mark has been seen at 1,2,3,4 locations and it knows how quickly it’s permitted to travel between 1 and 2 or 2 and 3 or 1 and 3.
If a journey is picked up that is quicker than the agreed threshold, it will take the images from the side of the road. “So it only retrieves the images if a violation has actually occurred,” he adds.
The system then provides a picture of the vehicle at ‘location 1’ and a picture of the vehicle at ‘location 2’ and the time to travel between those locations, which then creates a violation record.
“I think it’s simpler for people to understand as well: it took you so many seconds to drive from A to B, and you shouldn’t be able to do it in less time than that - therefore you’re driving too quickly over quite a long section of road,” Collins concludes.
")
")
")
")