
Vehicle-generated data has emerged as a vital missing piece in transport and infrastructure projects. By 2027, it’s estimated that there will be over 300 million connected vehicles across the globe, with the capacity to provide passive insights into driver behaviour and allow for proactive approaches to transport projects.
Connected vehicle data provides an enormous opportunity that hardware or mobile phone-based data collection cannot: unmatched scale, accuracy and granularity. One Australian council is putting it to the ultimate test: could connected vehicles be the key to finally outsmarting the rat runner?
What is rat running?
‘Rat running’ is when drivers take shortcuts through smaller residential streets that are not designed for high volumes of traffic. Drivers often take these shortcuts because of perceived shorter travel times or fewer delays caused by congestion and stopping at signalised intersections.
Vehicle-generated origin-destination data can help understand rat running by providing insight into travel times for various travel paths and speeds, and comparing the percentage of drivers that use different shortcuts to get from A to B.
Ku-ring-gai Council, located in the northern suburbs of Sydney, Australia, wanted to apply Compass data to a real-world problem: could it confirm if rat running was happening? And could connected vehicles help them implement measures to stop or reduce it? With access to over two million trips a day and over a billion data points, the council approached Compass IoT with four key questions:
- What shortcuts are drivers using?
- Which shortcut is the most popular?
- What time of day or day of the week is the rat running the most prevalent?
- What percentage of drivers are using any form of shortcut instead of using the main road?
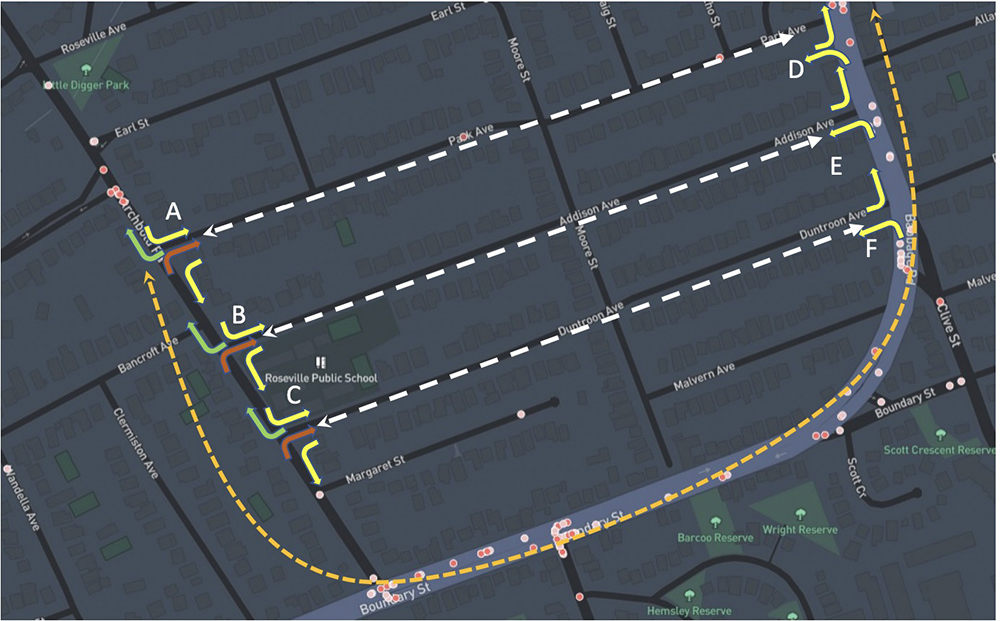
Compass conducted an origin-destination study to establish the total traffic volumes passing through an arterial road and any of the surrounding streets.
Next, the data was road-matched to establish the different paths that drivers took. This made it possible to identify what percentage of total traffic used shortcuts as opposed to main roads. Shockingly, the data revealed that more than half of all drivers meant to be using the main road were rat running.
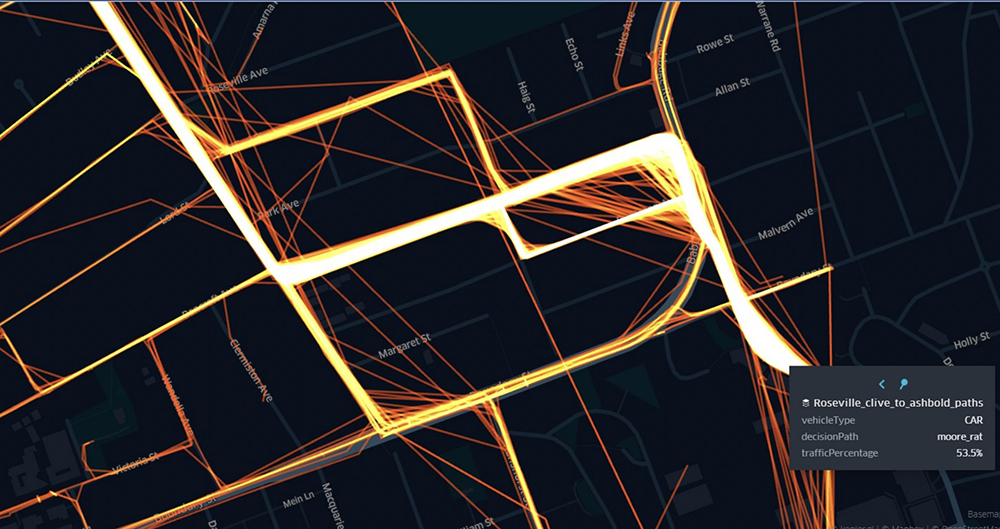
After the council had identified that a considerable number of drivers were using shortcuts, they took the data one step further by establishing which shortcut was the most popular as a percentage of rat runners. The council identified two residential streets as the most popular shortcuts: Moore Street and Park Avenue.
Finally, the council wanted to understand how this percentage fluctuated during different times and days of the week. Compass separated the data by hour, focusing on the differences across AM peak, PM peak, weekdays and weekends to compare how rat-running behaviour changed.
For non-peak hours, 87.5% of drivers were guilty of rat running. Park Avenue was the most popular rat run for non-peak drivers, with 57% of traffic using it to bypass the main road.
During the morning and afternoon peaks on Monday through Friday, Compass data showed that less than 8% of drivers used the main roads. In the PM peak, 49.2% of drivers used Park Avenue while 53% of drivers used Moore Street. This data highlights there is also some overlap between the paths rat runners take, with some drivers using a combination of streets.
The data gave a clear indication to the council of what type of traffic initiatives it can put in place to stop rat runs and where these schemes need to be implemented.
Ku-ring-gai Council is now taking further actions in consultation with the community to understand what traffic measures could prevent rat running without inconveniencing residents living on these streets. This includes further origin-destination studies to understand how many trips that originate from within these streets are due to the residents that live there, versus the number of drivers merely passing through from outside the local government area.
One of the initiatives the council is considering is installing ‘no right-hand turn’ signs on popular rat-running routes, preventing drivers from merging back onto the mainline. At this stage, it is unclear whether the banning of right-hand turns would solve the problem, or just move it elsewhere with drivers simply taking other shortcuts. Other considerations could be installing ‘no through traffic’ signage, preventing non-residents from using those routes during peak hours.
Connected vehicle data: the road forward
For the first time, we are able to identify exactly where rat running is happening and what percentage of drivers are engaging in this behaviour. Furthermore, the application of connected vehicle data goes far beyond understanding local traffic demand and origin-destination insights.
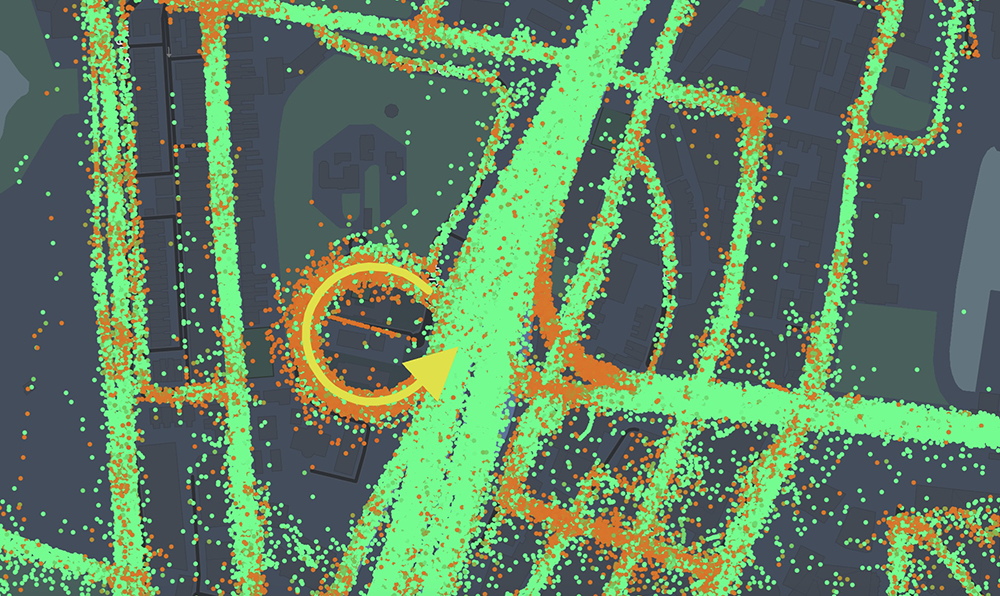
Compass g-force and speed data were used for curve advisory on the Cahill Expressway on-ramp. The on-ramp, which is a severe leftward bend that connects to the Sydney Harbour Bridge, has a speed limit of 60km/h and a curve advisory speed of 35km/h.
Connected vehicle data showed evidence of high g-forces, even if drivers were travelling at the lower curve advisory speed. There was also evidence of occasional unsafe speeds. Drivers were travelling 10-20km above the posted sign limit and recording g-forces of up to 0.8, well above the recommended safe g-force threshold of 0.47.
There was also evidence of harsh swerving. Compass Y acceleration data showed violent swerving to the left, with particularly violent g-force readings for vehicles travelling between 45-70km/h, a minimum of 10km/h above the curve advisory speed limit.
In another case study, a Northern Sydney council used Compass data to understand the driver behavioural changes resultant from the conversion of a busy two-way street, called The Strand, into a one-way street. The project was part of the Shared Spaces Program: a multi-million-dollar initiative allowing councils to pilot temporary traffic interventions to build use cases for more permanent changes across New South Wales.
Aside from understanding the before-and-after effects of the one-way conversion, the council also wanted to determine the impacts on 15 surrounding streets and six nearby intersections. It was concerned that the one-way conversion would cause safety issues in other streets as a result of traffic re-direction.
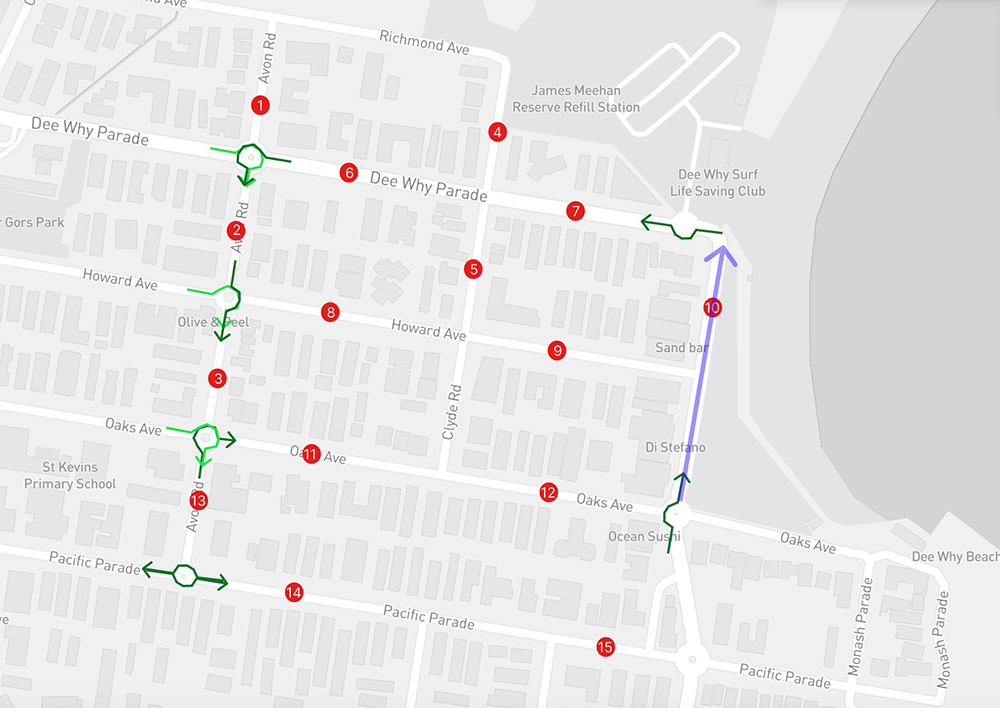
To determine whether the change should be permanent, the council collected vehicle speed data and g-force data: instances where drivers were losing friction due to hard braking or swerving, providing a leading indicator of road safety risk. If the one-way conversion led to higher speeds and g-forces in surrounding streets, the council could mitigate these risks by changing or removing the pilot scheme.
The results of this scheme were overwhelmingly positive. Compass data showed that both drivers’ speed and g-forces in the surrounding roads dropped after the one-way was implemented. On average, speed decreased by 7% across the 15 surrounding roads. For The Strand, the 85th percentile speed dropped by almost 7km/h while g-forces dropped 0.01g.
There is an ever-expanding list of use cases where connected vehicle data can help deliver better outcomes for stakeholders and communities. This includes but is not limited to:
- proactively monitoring road safety and profiling risk
- impacts of level-crossing removals
- supporting decarbonisation and electric vehicle utilisation modelling
- monitoring before and after effects of traffic interventions
- insights into weather impacts on road lifespans as measured by changes to road roughness
A significant opportunity for connected vehicle data is in the seamless integration of road user charging (RUC) for congestion and electric vehicle use cases. In particular, as the rate of EV ownership continues to grow, governments are set to lose billions in fuel tax revenue that is used to fund infrastructure upgrades.
In Australia, current RUC schemes involve cumbersome and manual odometer reporting with annual audits. This form of RUC lacks nuance and equitability. There is no way to differentiate between kilometres driven on public and private roads, including whether a driver has already paid a toll for use of those roads. It also fails to account for disparities between urban and rural areas, the latter often having to drive longer distances with fewer public transport alternatives.
In a similar vein, vehicle-generated data takes the guesswork out of EV infrastructure utilisation modelling, particularly if many governments want to achieve their ambitious targets of banning the sale of new internal combustion engine (ICE) vehicles within the next five to 10 years.

The capability that vehicle-generated data provides for RUC, rat running and other infrastructure initiatives is flexibility: the ability to differentiate by location; by kilometres driven on public roads, private property and toll roads; to tax more equitably, and to proactively solve transport problems with powerful empirical evidence.
About the Author:
Emily Bobis is founder of Compass IoT, an Australia-based company which creates road intelligence software using connected car data


")

")

")
")
")
")